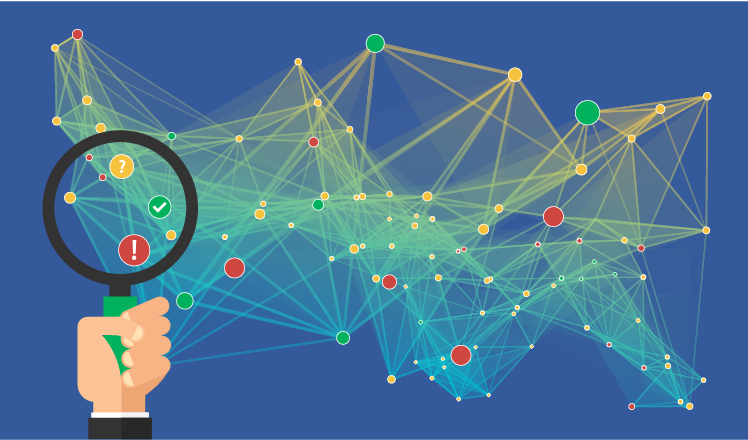
Welcome to the World of Data
The fact that Tompkins needs to reorganize the entire organizational structure simply to please an ignorant manager seems quite realistic. Even though they had carefully planned the projects and the experiment and had set up the project teams with a lot of expertise, now all these need to be done “hidden away” just so the top management is pleased.
Mr. T. Johns is introduced, who works for a small company which expresses sizes of projects in “function points”. Upon arrival, he already knows the exact number of programmers, workstations, computer models … of the entire country of Morovia. However, it doesn´t stop just there, as he can also recall average temperatures, average rainfall, wine production etc. Clearly, he is that kind of person who likes to express themselves in numbers and who likes to put everything into a mathematical context.
However, even though when leaving it seems like Mr. Tompkins and General Markov still hadn´t quite caught up with all calculations that Mr. Johns produced, the final result was definitely worth it as now, each project has its size expresses in function points ranging from 1,500 to 6,500 points. Yet, did need Belinda to bridge the gap between the table of function points and the simulation models they had done previously. She explains to them that the function points are basically nothing more than the amount of work and effects they had used to establish their simulations.
However, in order to predict productivity and to know the variation in function points of a project, some mathematical values derived from other products are needed to calculate means and variations.
Here we can learn about the importance of archaeology and considering past experiences to make better predictions for the future. Just like Webster wants to develop products in a way that can be used for learning as well, analyzing old projects can produce important insights.
Analysis like these can be extremely helpful not only for measuring projects but also for improving business processes and productivity in general. Especially nowadays with all the data we have available already anyways, it should be quite easy to develop functions and algorithms which can predict the future better than we ourselves ever could. This is something I experienced at my last work as well, where data of car sales was put into an algorithm that in the end could predict exactly how many days it would take for each single car produced to be sold to a buyer, depending on factors such as car color, equipment, location, date… What I learned during that time as well is what incredible amounts of data we collect every day and accumulate over time, and yet we almost don´t do anything at all with that data just because we don´t know where to look or where to start.

During the first wave of digitalization the saying “Data is the new oil” had been developed. And just as with oil, you can only turn data into something valuable if you know where to look for it and how to treat it correctly. Of course, analyzing data is quite complicated, as it can exists in a broad variety of data types, layers, systems … and finally, you don´t only need to put that data together, but first of all you need to understand what insights you want to derive and what purpose that data can fulfill. Therefore, it is important to have the right people for such tasks, such as in the book where Waldo is working together with a statistics person as well as a programmer analyst, to have all necessary skills combined.
Here Mr. T. also needs to remember that as a manager, you cannot assign roles to people that you would like them to be in, but that sometimes you need to let people do other jobs where they can better use their talents and skillset, such as letting go of Waldo for him to analyze the projects of the past.
Belinda’s realization that they themselves could have done an analysis of the projects already shows once more how important it can be to bring in people from the outside for new perspectives and working methods.
At the end of the day, Mr. T. makes another entry into his journal on the issue of Project Metrics:
- Size every single product.
- Don’t sweat the units-while you’re waiting to achieve objective metrification, use subjective units.
- Form synthetic metrics from all the primitives (countable characteristics of the software) available to you.
- Collect archaeological data to derive productivity trends from now-ended projects.
- Tinker with the formulation for your synthetic metric until its values give the best correlation to Effort for the set projects in your archaeological data base.
- Draw a trend line through your database, showing expected Effort as a function of values of the synthetic metric.
- Now, for each new project to be estimated, compute value of the synthetic metric and use it to pick off expected Effort from the trend line.
- Use the noise level around the productivity trend as an indicator of what tolerance to apply to the projections.
